
The Perfect Portfolio Management Tool
Here is a free infographic on the topic of this post in case you want to rush it. Click the Button below to download it.
When it comes to big businesses, understanding how they are organized may be a tedious process. Figuring out the business portfolio of the company even more daunting due to the possible presence of numerous products and subsidiaries, i.e. smaller companies "held", or "controlled" by the Parent company.
The BCG Matrix (Boston Consulting Group Matrix, also known as "Growth Share Matrix") is a portfolio management framework that is used internally by companies in order to help prioritize their businesses based on their degree of profitability in relation to the market.
Let's start from the origins. It is 1968 in Boston (USA), when Bruce Henderson, founder of the Boston Consulting Group, creates the Growth Share Matrix. With the foundational concept behind the matrix being that market leadership results in sustainable superior returns, Henderson designed the framework based on two factors companies should consider: the market share (how competitive the firm is), and the growth rate of the market (how attractive the market is for the future).
So, the Growth Share Matrix is used for portfolio management. As the portfolio of a corporation is the set of all the businesses and products that make up the structure of the company and its assets, portfolio management refers to the activity of making sure those businesses and products are being profitable and useful for the business in order to increase its value. So, a firm's portfolio must be tracked, evaluated, and adjusted according to its trajectory just like an investment portfolio.
The BCG Matrix is one of the tools that helps corporations to do just that: identify the position and profitability of each product or business unit with respect to the market. This analysis helps managers to craft strategies to properly put the products to their best use and exploit their potential as much as possible.
The 4 Combinations
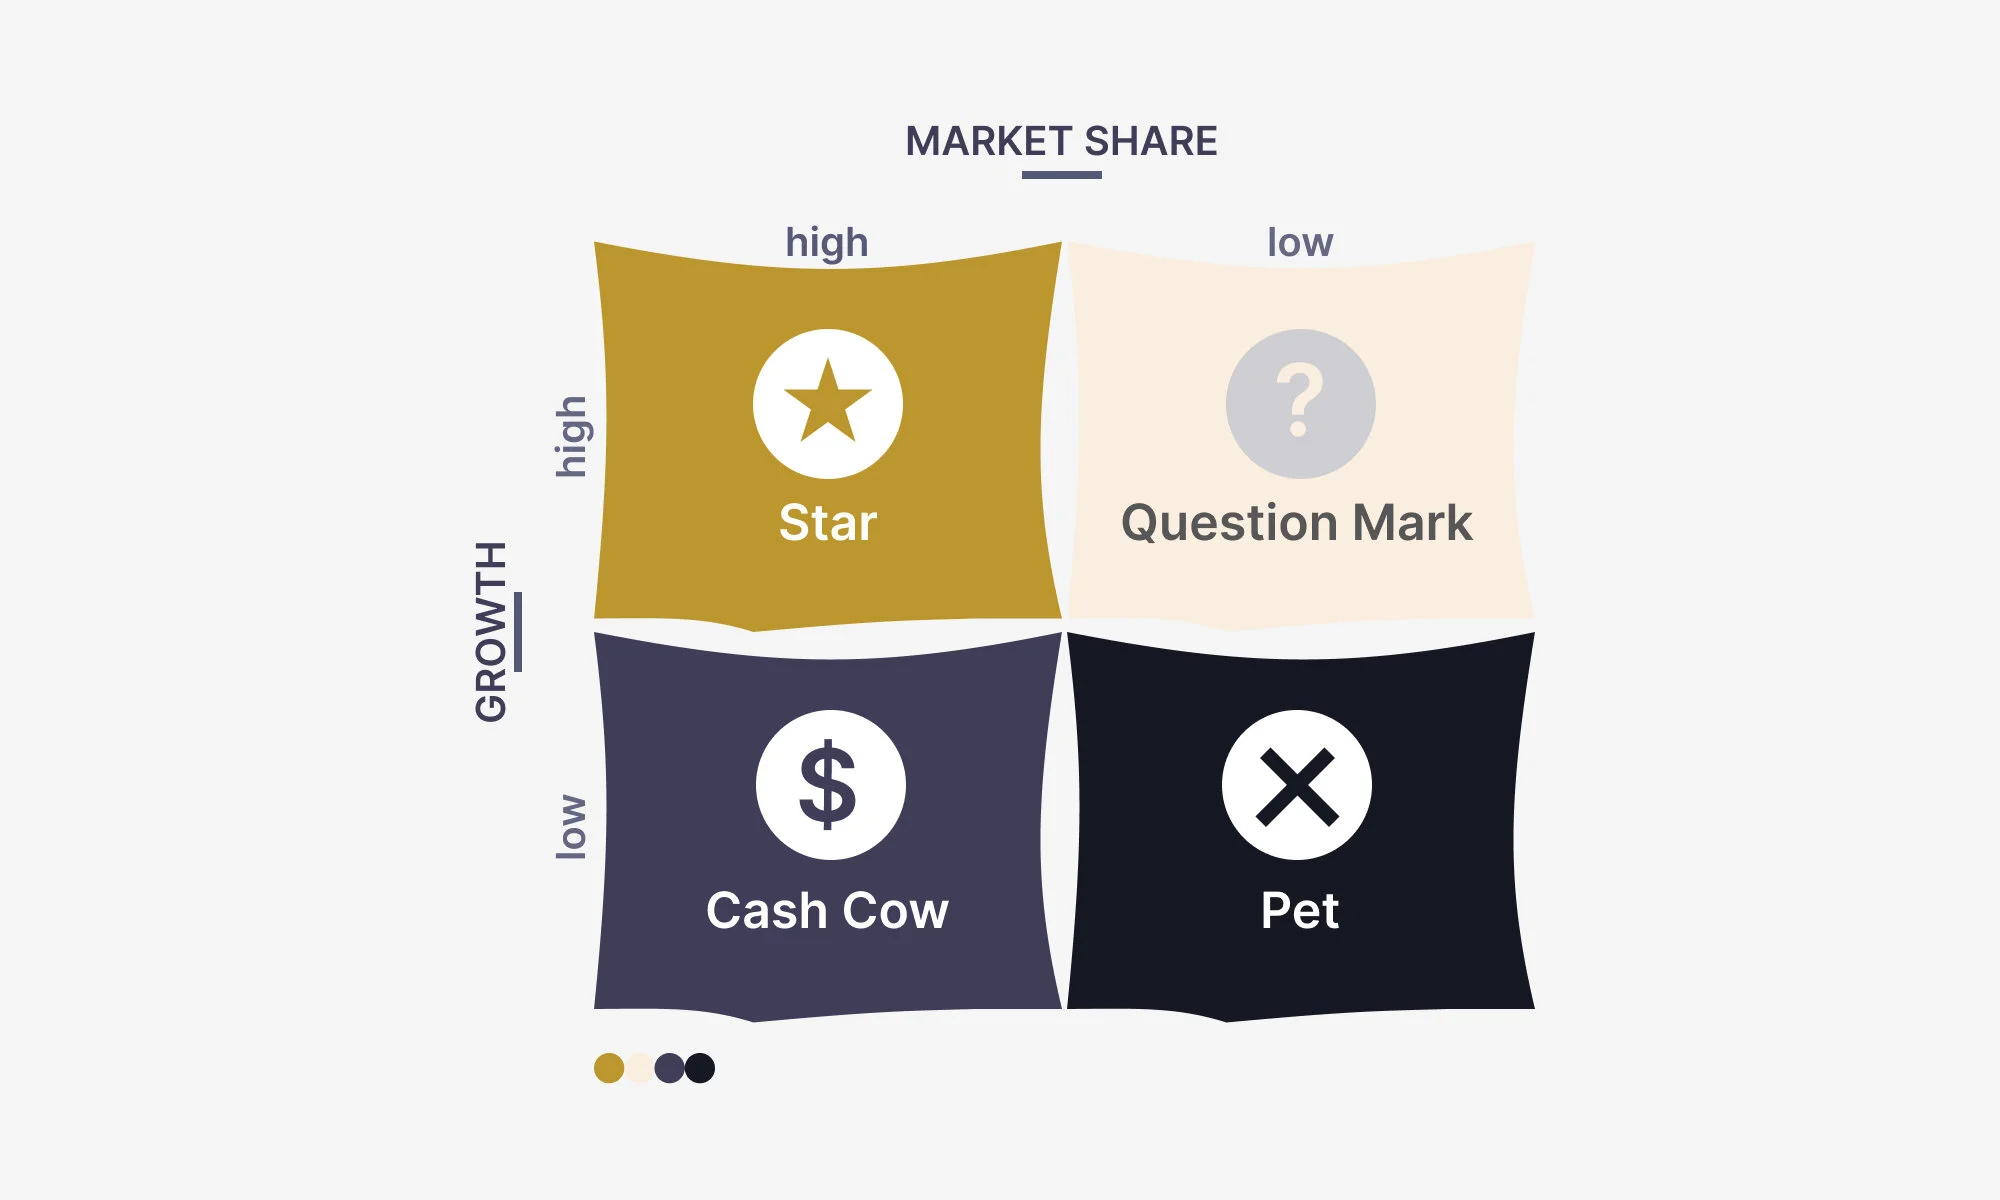
There exist 4 outcomes based on the combinations of relative market share and growth rate resulting from the Growth Share Matrix assessment.
Stars ⭐
Stars are products characterized by high growth rate and high market share.
This is, together with the next one, the most desired outcome in the matrix. Stars are in a very advantageous position in the market; they bring positive cash flow to the company; and they have future potential for growth. This makes them worthy of significant investment and attention, in order for the business to take advantage of the flourishing situation stars are in and double down on it.
Cash Cows 💰
Cash Cows are products characterized by low growth rate and high market share.
These cash cows generate a lot of positive cash flow, but do not have future potential, or the market they are in does not have a prosperous future ahead. Still, the products falling under this category are catalyst for cash generation for the business; cash which is used to be reinvested in high-growth-rate products (e.g. stars).
Question Marks ❓
Question Marks are products characterized by high growth rate and low market share.
As the foundational concept of the Growth Share Matrix is that market leadership makes for sustainable returns, question marks can be seen either as opportunities to invest in, or as wasteful resources to be discarded. The former belief may stem from the fact that question marks dispose of high growth rates, making them possible stars or cash cows in the future. As long as they remain question marks, however, these products do not bring in cash, which requires the management to decide whether the trade-off of keeping them for a possible bright future instead of discarding them owing to their negative cash flow is worth it.
Pets ❌
Pets are products characterized by low growth rate and low market share.
This is the worst position to be in. Companies can make one of two possible decisions: liquidate the product / business unit; or completely reposition the pet.
How the Growth Share Matrix Can Be Applied to Personal Life
Living a more essential, intentional life requires to "invest" in those activities that we really care about and "liquidate" the pets in our lives. The first step towards having clarity about what is essential for us, as Greg McKeown suggests in his Skillshare class, is to ask ourselves: what is essential to me right now but I am under-investing in? A modified approach of the Growth Share Matrix applied to our personal sphere can help identify our stars, cash cows, question marks, and pets.
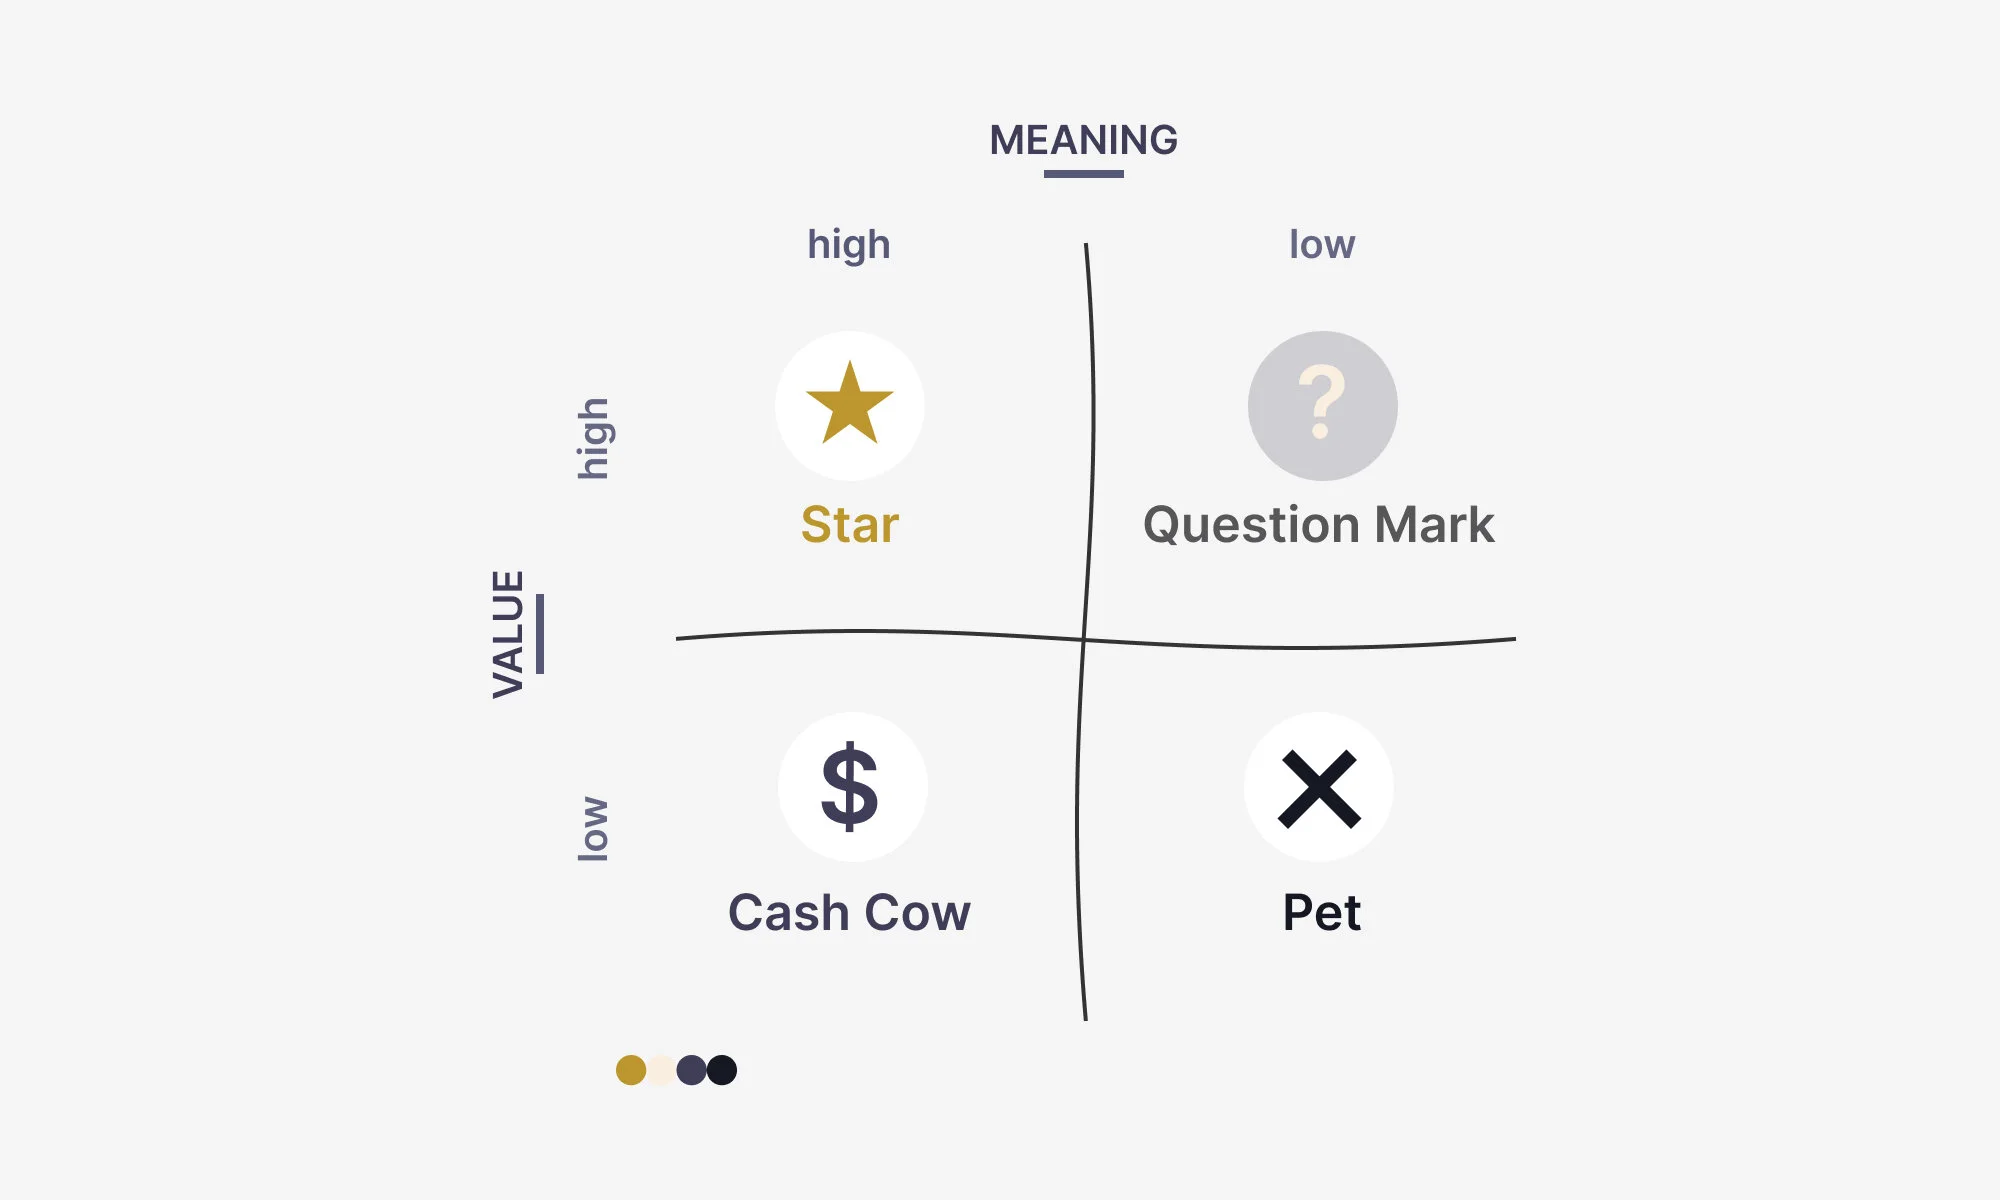
The “personal growth share matrix” has its pillars on two dimensions: Meaning and Value. Meaning refers to those activities or objectives you feel intrinsically motivated to pursue, not because of external reasons such as money, but simply due to the positive feelings you associate with that thing. Value, on the other hand, can be either monetary or non-monetary. Value refers to the impact the activity or objective has on your life. It can be monetary value, or intangible (e.g. going for a hike with my wife every week strengthens our relationship and makes us spend some quality time together, which may lead to a more mindful and balanced relationship over the long term).
Stars are the things to double down on. They have high meaning and high value. They are the core activities (or tasks, or goals) you should spend the most time working on.
Cash Cows have high meaning and low value. Those are usually passions and hobbies, which are done just for the sake of them, because they make us feel at peace.
Question marks are characterized by low meaning and high value. These can be related to work or can be repetitive activities that are boring but necessary and bring some value (monetary in the case of work).
Pets are the lowest in the hierarchy. Low meaning and low value. You probably want to reconsider these pets and maybe get rid of them or at least invest as little time as possible in them.
FOOTNOTES
business portfolio: the set of all the businesses and products that make up the structure of the company and its assets.
RESOURCES
If you have arrived here, you may also be interested in: